External Validation
Doing machine learning with relatively scarce labeled data points is always challenging to validate, especially since Speos is designed for positive-unlabeled scenarios, where we assume that some of the unlabeled genes are actually positives, making the ‘internal’ validation with a hold-out set somewhat unreliable. To improve upon this weakness, we have added an array of external validation datasets which serve as alternative label sets. The datasets have been selected to have the lowest possible bias, i.e. not being influenced by the training labels.
The external validations are run by the speos.postprocessing.postprocessor.Postprocessor class, which is automatically run when running the outer_crossval.py and postprocessing.py pipelines, as detailed here.
Before the postprocessor can perform the external validation, you have to train a crossvalidation ensemble, read the respective documentation on how to do this if you haven’t done it already.
Now, we want to take a look into the individual means of external validation, or tasks, how they are called within the framework. To do that, we will look at the log of a run that produced candidate genes for cardiovascular disease. If you cant find your log, check your config file, the logs are placed in config.logging.dir/config.name.
Differential Gene Expression
The DGE task relies on data obtained from the GEMMA database. We have defined several sub-phenotypes for every disorder and queried GEMMA for genes that are differentially expressed if that sub-phenotype is present. For further methodological details on this task consult the method section in our preprint
Note
This task is disease-specific. We have added subtypes for five diseases, which are also discussed in our preprint. Adding new subtypes for these or other, potentially custom, diseases is documented elsewhere.
One of the subtypes defined for the disorder cardiovascular disease is coronary artery disease. The related part of the logfile is as follows:
1cardiovascular_gcn 2023-02-22 14:48:35,484 [INFO] speos.postprocessing.postprocessor: Starting Differential Gene Expression Enrichment Analysis.
2cardiovascular_gcn 2023-02-22 14:48:35,523 [INFO] speos.postprocessing.postprocessor: Found 6 subtypes for phenotype cardiovascular_disease: ['Coronary Artery Disease', 'Atrial Fibrillation', 'Aortic Aneurysm', 'Ischemia', 'Hypertension', 'Atherosclerosis'].
3cardiovascular_gcn 2023-02-22 14:48:35,691 [INFO] speos.postprocessing.postprocessor: Total of 552 Coronary Artery Disease DE genes, 473 of them match with our translation table.
4cardiovascular_gcn 2023-02-22 14:48:35,691 [INFO] speos.postprocessing.postprocessor: Found 98 Coronary Artery Disease DE genes among the 584 known positive genes (p: 7.96e-50, OR: 8.798), leaving 375 in 16736 Unknowns
5cardiovascular_gcn 2023-02-22 14:48:35,694 [INFO] speos.postprocessing.postprocessor: Fishers Exact Test for Coronary Artery Disease DE genes among Predicted Genes. p: 4.49e-21, OR: 4.674
6cardiovascular_gcn 2023-02-22 14:48:35,694 [INFO] speos.postprocessing.postprocessor: Coronary Artery Disease DE genes Confusion Matrix:
7[[   66   309]
8[  715 15646]]
This indicates that, while in total 552 genes are labeled as differentially expressed, only 473 match with the HGNC symbols that are contained in our graph.
Second, 98 of the 473 DGE genes can be found within the 584 Mendelian disorder genes, which corresponds to an odds ratio (OR) of 8.798 with a p-value of 7.96e-50. Quite significant! This significant odds ratio serves as positive control, meaning that the differentially expressed genes for coronary artery disease are indead related to our label set for cardiovascular disease. This leaves 473 - 98 = 375 in the total 16736 unlabeled genes from which we predict our candidates.
Third, when looking at the confusion matrix, 66 out of 781 (66 + 715) candidates are differentially expressed, which corresponds to an OR of 4.674 with a p-value of 4.49e-21. While this is not as high as for the the Mendelian disorder genes, it is still quite high!
This is now done for the other 5 registered sets of differentially expressed genes.
Gene Set Enrichment Analysis
Gene set enrichment analysis (GSEA) has a long-standing tradition in biology. In its essence, it takes a set of genes (in our case our candidate genes) and compares it to an ontology. This ontology consists of groups of genes that group together by a shared funtion, pathway, cellular component or other categories. Then, a statistical analysis is conducted how the proposed set of genes is distributed among these ontology groups. Some groups are overrepresented compared to random expectation, and this enrichment is expressed in form of a factor and a p-value.
Finally, if the proposed gene set should capture the characteristics of a given trait or disease, we would expect that the enriched functions, pathways etc. are representative for this disease.
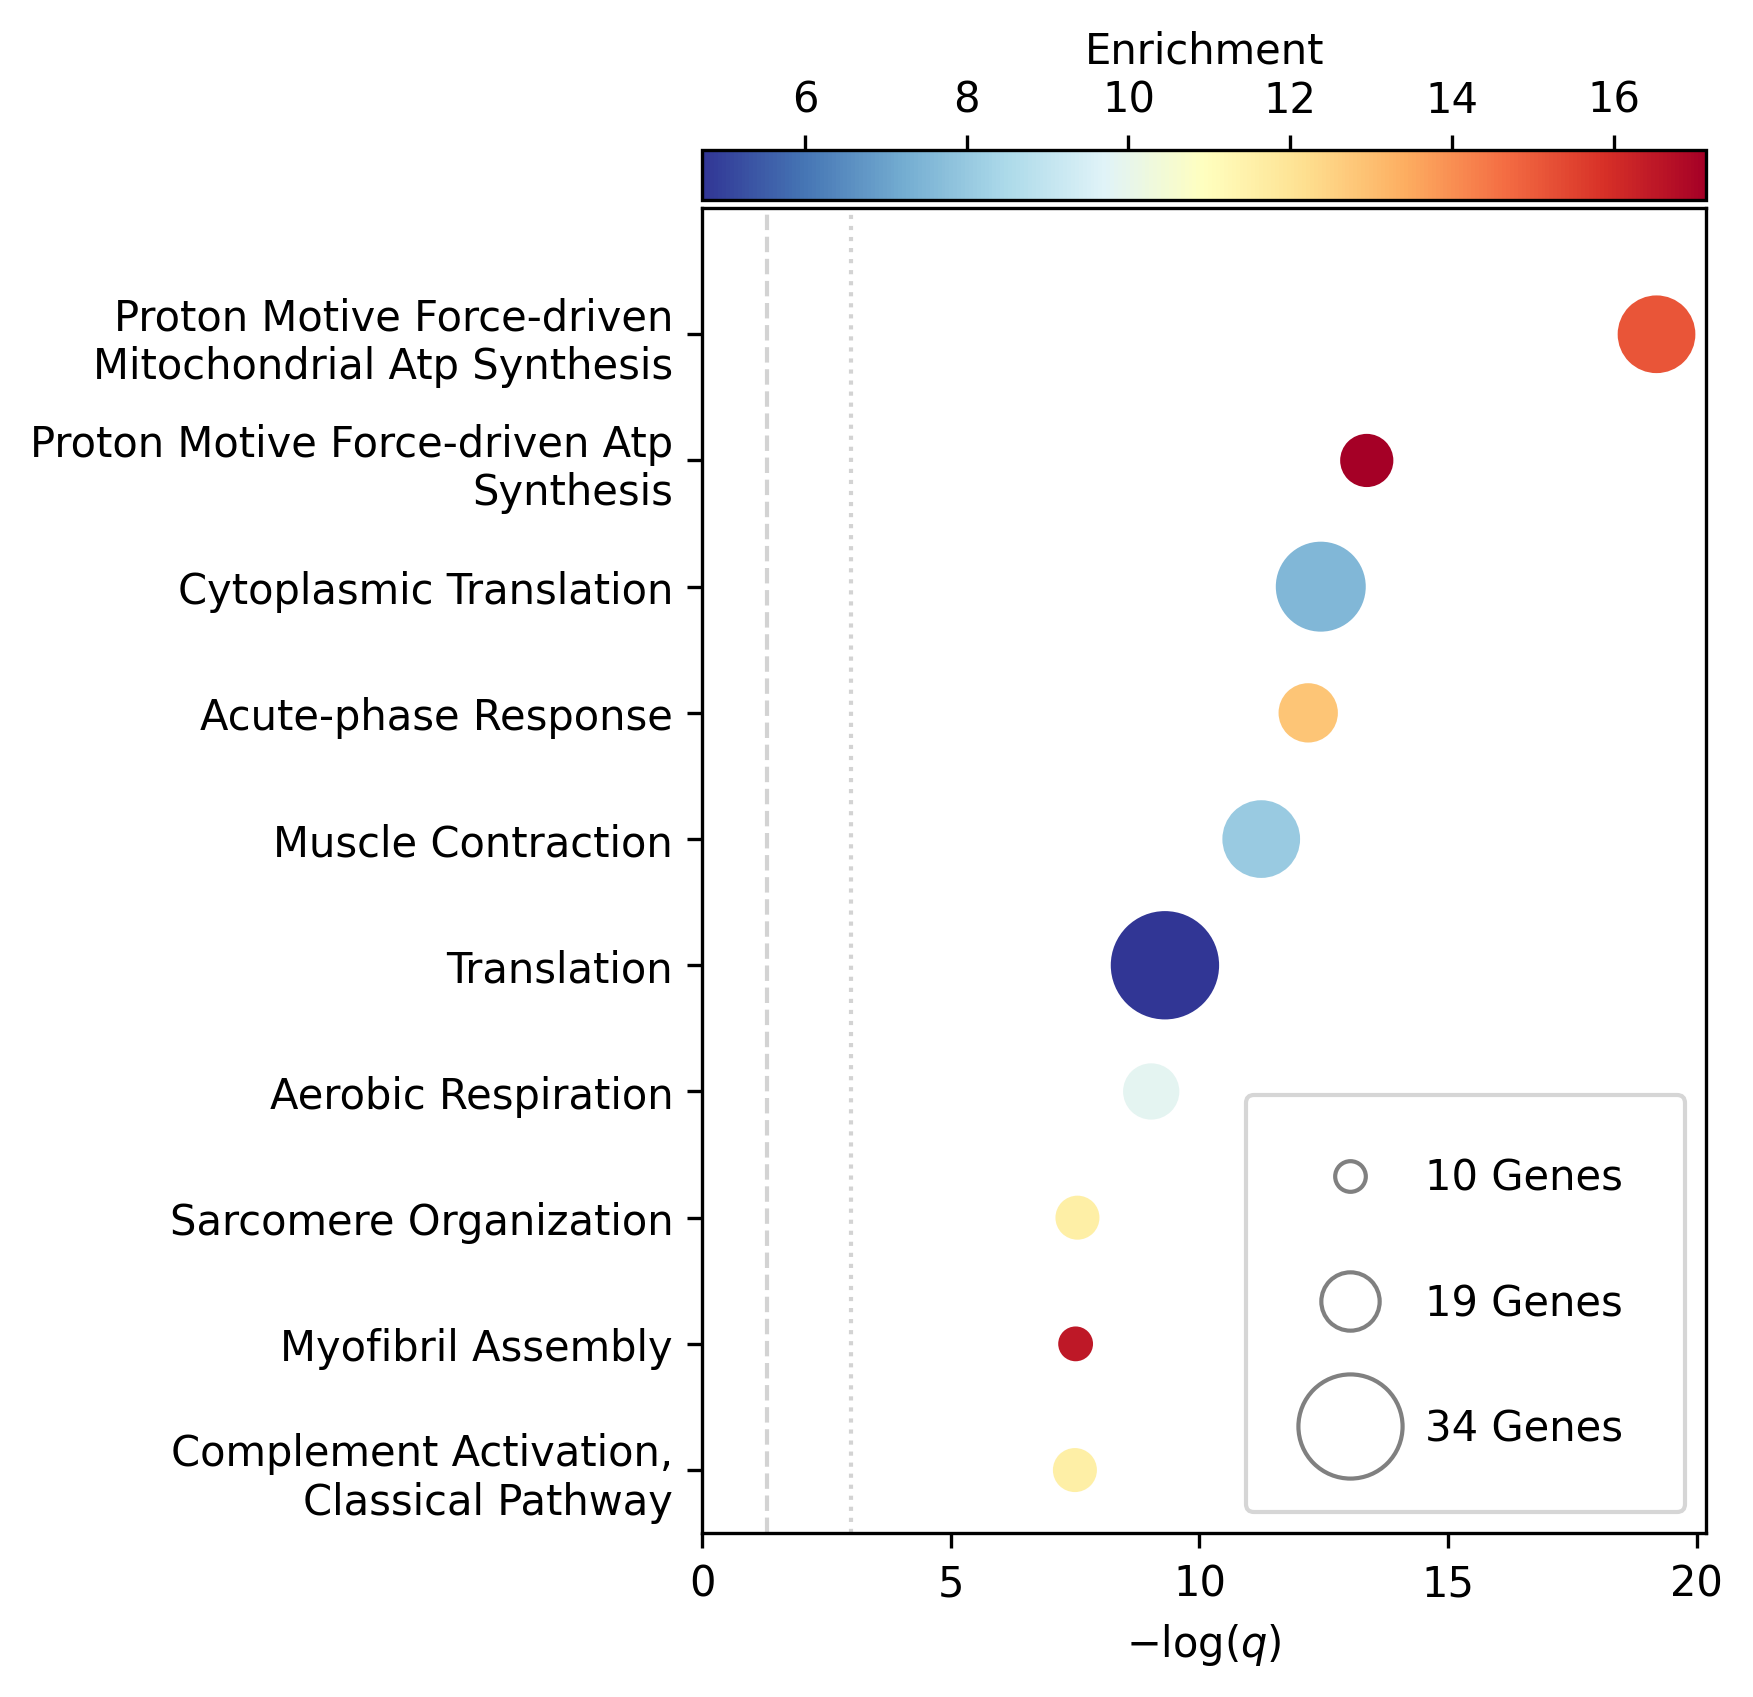
In total, five different types of GSEA are pre-implemented in Speos, differing in the type of ontology they use: Pathways (Wikipathways), Human Phenotype Ontology (HPO), and the Gene Ontology (GO) categories biological process, molecular function and cellular component. For each of the GSEA runs you get a short overview of how many ontology terms are significantly enriched in the logs (see below). On top of that, the full list of enriched terms together with enrichment factor and p-value are written to a tsv table so they can be examined more closely. Finally, plots are generated that display the same data as the tables for a faster visual inspection.
 1cardiovascular_gcn 2023-02-22 14:48:36,241 [INFO] speos.postprocessing.postprocessor: Starting Pathway Enrichment Analysis.
 2cardiovascular_gcn 2023-02-22 14:48:36,336 [INFO] speos.postprocessing.postprocessor: Reading translation table from ./data/hgnc_official_list.tsv
 3cardiovascular_gcn 2023-02-22 14:48:39,990 [INFO] speos.postprocessing.postprocessor: Found 34 significant terms, writing table to ./results/cardiovascular_gcn_pathwayea.tsv
 4cardiovascular_gcn 2023-02-22 14:48:40,029 [INFO] speos.postprocessing.postprocessor: Saving plot to ./plots/cardiovascular_gcn_pathwayea.png
 5cardiovascular_gcn 2023-02-22 14:48:43,542 [INFO] speos.postprocessing.postprocessor: Starting HPO Enrichment Analysis.
 6cardiovascular_gcn 2023-02-22 14:48:43,664 [INFO] speos.postprocessing.postprocessor: Reading translation table from ./data/hgnc_official_list.tsv
 7cardiovascular_gcn 2023-02-22 14:49:14,194 [INFO] speos.postprocessing.postprocessor: Found 127 significant terms, writing table to ./results/cardiovascular_gcn_hpoea.tsv
 8cardiovascular_gcn 2023-02-22 14:49:14,280 [INFO] speos.postprocessing.postprocessor: Saving plot to ./plots/cardiovascular_gcn_hpoea.png
 9cardiovascular_gcn 2023-02-22 14:49:21,906 [INFO] speos.postprocessing.postprocessor: Starting GO Enrichment Analysis.
10cardiovascular_gcn 2023-02-22 14:49:45,849 [INFO] speos.postprocessing.postprocessor: Found 78 significant terms for task biological process, writing table to ./results/cardiovascular_gcn_goea_biological_process.tsv
11cardiovascular_gcn 2023-02-22 14:49:45,865 [INFO] speos.postprocessing.postprocessor: Saving plot to ./plots/cardiovascular_gcn_goea_biological_process.png
12cardiovascular_gcn 2023-02-22 14:50:03,321 [INFO] speos.postprocessing.postprocessor: Found 57 significant terms for task molecular function, writing table to ./results/cardiovascular_gcn_goea_molecular_function.tsv
13cardiovascular_gcn 2023-02-22 14:50:03,371 [INFO] speos.postprocessing.postprocessor: Saving plot to ./plots/cardiovascular_gcn_goea_molecular_function.png
14cardiovascular_gcn 2023-02-22 14:50:20,456 [INFO] speos.postprocessing.postprocessor: Found 75 significant terms for task cellular component, writing table to ./results/cardiovascular_gcn_goea_cellular_component.tsv
As an example, here are the first lines of the GSEA for GO biological process:
 1                fdr_q_value             p_value genes           description     observed        total   expected        enrichment      log_q
 2GO:0042776      6.419590551030668e-20   5.125830845600981e-24   NDUFAB1;NDUFS5;NDUFB1;ATP5PD;ATP5MG;NDUFB6;NDUFB4;NDUFB10;ATP5F1B;NDUFB7;ATP5PF;ATP5PB;ATP5F1A;ATP5F1D;ATP5F1C;ATP5PO;NDUFA8;ATP5MF;ATP5F1E;ATP5ME;NDUFA6;SDHC;NDUFA13;STOML2   Proton Motive Force-driven Mitochondrial Atp Synthesis  24      34      1.5866395793499044      15.126308654063418      19.19249267085618
 3GO:0015986      4.3194905567478847e-14  6.897940844375415e-18   ATP5PD;ATP5MG;ATP5MC1;ATP5F1B;ATP5PF;ATP5PB;ATP5F1A;ATP5F1D;ATP5F1C;ATP5PO;ATP5MC3;ATP5MF;ATP5F1E;ATP5ME;ATP5MC2;ATP5MK Proton Motive Force-driven Atp Synthesis        16      20      0.9333173996175909      17.14314980793854       13.36456747111097
 4GO:0002181      3.633652945419001e-13   8.704055282862506e-17   RPLP1;RPLP2;RPLP0;RPL35A;RPL13;RPL12;RPL9;RPL4;RPL5;RPL21;RPS5;RPL29;RPL14;RPS3A;RPL26;RPL27;RPS16;RPS29;RPL23;RPS24;RPS25;RPS26;RPL30;RPL10A;RPL32;RPL11;RPL24;RPL19   Cytoplasmic Translation 28      80      3.7332695984703634      7.500128040973111       12.43965655503765
 5GO:0006953      6.501057068304837e-13   2.0763516666575653e-16  ASS1;SERPINA1;SERPINA3;A2M;CRP;APCS;FN1;ORM1;AHSG;TFRC;SERPINF2;SAA1;SAA2;LBP;ORM2;SAA4;ITIH4;CD163     Acute-phase Response    18      30      1.3999760994263863      12.857362355953905      12.187016021571488
 6GO:0006936      5.727016931615222e-12   2.2864168522896928e-15  FXYD1;MYL1;CKMT2;HRC;CALD1;TRDN;GAMT;TRIM63;MYLPF;ANKRD2;MYH2;CERT1;TMOD4;LMOD2;MYH1;TPM2;TNNT1;TMOD1;MYOM3;TPM4;LMOD1;MYOM1;MYOM2;TNNI1        Muscle Contraction      24      64      2.9866156787762907      8.03585147247119        11.24207153291667
 7GO:0006412      4.952007184843684e-10   2.372408424549833e-13   RPLP1;RPLP2;RPLP0;RPL35A;RPL13;RPL12;RPL9;RPL4;RPL5;RPL21;RPS5;RPL29;RPL14;RPS3A;RPL26;RPL27;RPS16;RPS29;RPL23;RPS24;RPS25;RPS26;RPL30;RPL10A;RPL32;RPL11;RPL24;RPL19;EIF4G1;PABPC4;MRPL51;RPL36AL;EEF1A2;MRPL12        Translation     34      154     7.186543977055449       4.731064070372649       9.305218733871682
 8GO:0009060      9.349694705770931e-10   5.225795507856637e-13   NDUFAB1;NDUFS5;NDUFB1;NDUFB6;NDUFB4;NDUFB10;UQCRH;NDUFB7;UQCRC2;ATP5F1D;UQCRC1;MDH2;NDUFA8;NDUFA6;OXA1L;SDHC;NDUFA13    Aerobic Respiration     17      37      1.7266371892925432      9.845727930234972       9.029202569850872
 9GO:0006958      3.2020976539954114e-08  2.0454153011788e-11     MASP2;C5;C9;C4BPA;SERPING1;CFI;C2;C8A;C8B;C8G;C1S;C7;C1QBP      Complement Activation, Classical Pathway        13      24      1.119980879541109       11.60734101579172       7.4945654275870375
10GO:0045214      2.846309025773699e-08   2.0454153011788e-11     KLHL41;ITGB1;CAPN3;CASQ1;MYOM2;ANKRD1;LMOD2;SYNPO2L;MYOZ1;CFL2;CSRP1;TNNT1;WDR1 Sarcomere Organization  13      24      1.119980879541109       11.60734101579172       7.545717950034419
11GO:0045333      3.284414314881856e-08   2.6224962590880362e-11  NDUFA4;UQCRQ;UQCR11;UQCRH;CYC1;COX6C;COX5B;COX4I1;COX7C;COX5A;UQCRC2;UQCRC1;CYCS;UQCR10 Cellular Respiration    14      29      1.3533102294455068      10.34500419444567       7.483542063697089
12GO:0030239      3.098886957011646e-08   2.721794676391577e-11   KLHL41;CAPN3;MYOZ1;MYL9;PGM5;LMOD2;FLII;TMOD4;LMOD1;TMOD1       Myofibril Assembly      10      13      0.606656309751434       16.483797892248596      7.508794265916731
13GO:0006956      2.9778377494698357e-07  2.8532460071573e-10     CFD;C2;C8A;CFHR1;CFHR3;C7;CFB;C9;CFHR2;CFHR4;C8B        Complement Activation   11      19      0.8866515296367113      12.406226834692363      6.526098968917478
14GO:0006957      3.5807728270686596e-07  3.7168673548301316e-10  CFD;CFB;C5;C9;C8A;C8B;C8G;C7    Complement Activation, Alternative Pathway      8       9       0.41999282982791586     19.047944231042823      6.446023230811629
And here is the accompanying plot, truncated to the top 10:
Drug Targets
Drug targets can be used as a validation method for a gene’s (or, more correctly, it’s protein product’s) implication in disease. We are aware that there are many biases and restrictions to past drug development, but nonetheless, we would expect a disease-relevant group of genes to have more drugs targeting them than a disease-irrelevant group of genes
We have therefore made use of the Drug Repurposing Knowledge Graph (DRKG) and mined all interactions that run between drugs and genes after excluding all relations that have been mined from preprint servers.
In the following you can see the output of the individual parts of the drug target analysis:
1cardiovascular_gcn 2023-02-22 14:50:26,487 [INFO] speos.postprocessing.postprocessor: Reading compound drug interaction graph from ./data/drkg/cgi.tsv
2cardiovascular_gcn 2023-02-22 14:50:27,755 [INFO] speos.postprocessing.postprocessor: Reading translation table from ./data/hgnc_official_list.tsv
3cardiovascular_gcn 2023-02-22 14:50:28,316 [INFO] speos.postprocessing.postprocessor: Total of 8888 drug targets, 8381 of them match with our translation table.
4cardiovascular_gcn 2023-02-22 14:50:28,317 [INFO] speos.postprocessing.postprocessor: Found 471 drug targets genes among the 584 known positive genes (p: 6.84e-60, OR: 4.651), leaving 7910 in 16736 Unknowns
5cardiovascular_gcn 2023-02-22 14:50:28,341 [INFO] speos.postprocessing.postprocessor: Fishers Exact Test for Drug Targets among Predicted Genes. p: 1.19e-74, OR: 4.329
6cardiovascular_gcn 2023-02-22 14:50:28,342 [INFO] speos.postprocessing.postprocessor: Drug Targets Confusion Matrix:
7[[ 613 7297]
8[ 168 8658]]
These lines correspond to a binary drug target analysis, meaning each gene is either counted as a drug target if it is targeted by at least one drug or as a non-target if no drug targets it. The log indicates that, while in total 8888 genes are labeled as drug targets, only 8381 match with the HGNC symbols that are contained in our graph.
Second, 471 of the 8381 drug targets can be found within the 584 Mendelian disorder genes, which corresponds to an odds ratio (OR) of 4.651 with a p-value of 6.84e-60. This tells us that the Mendelian disorder genes for cardiovascular disease have been in the focus of drug development, a finding that serves as a positive control for this external validation. 8381 - 471 = 7910 drug targets are left in the total 16736 unlabeled genes from which we predict our candidates.
Third, when looking at the confusion matrix, 613 out of 781 (613 + 168) candidates are drug targets, which corresponds to an OR of 4.329 with a p-value of 1.19e-74. We therefore see that our proposed candidate genes have also been in the focus of drug deleopment, just as the positive control Mendelian disorder genes!
Let’s continue with the next part:
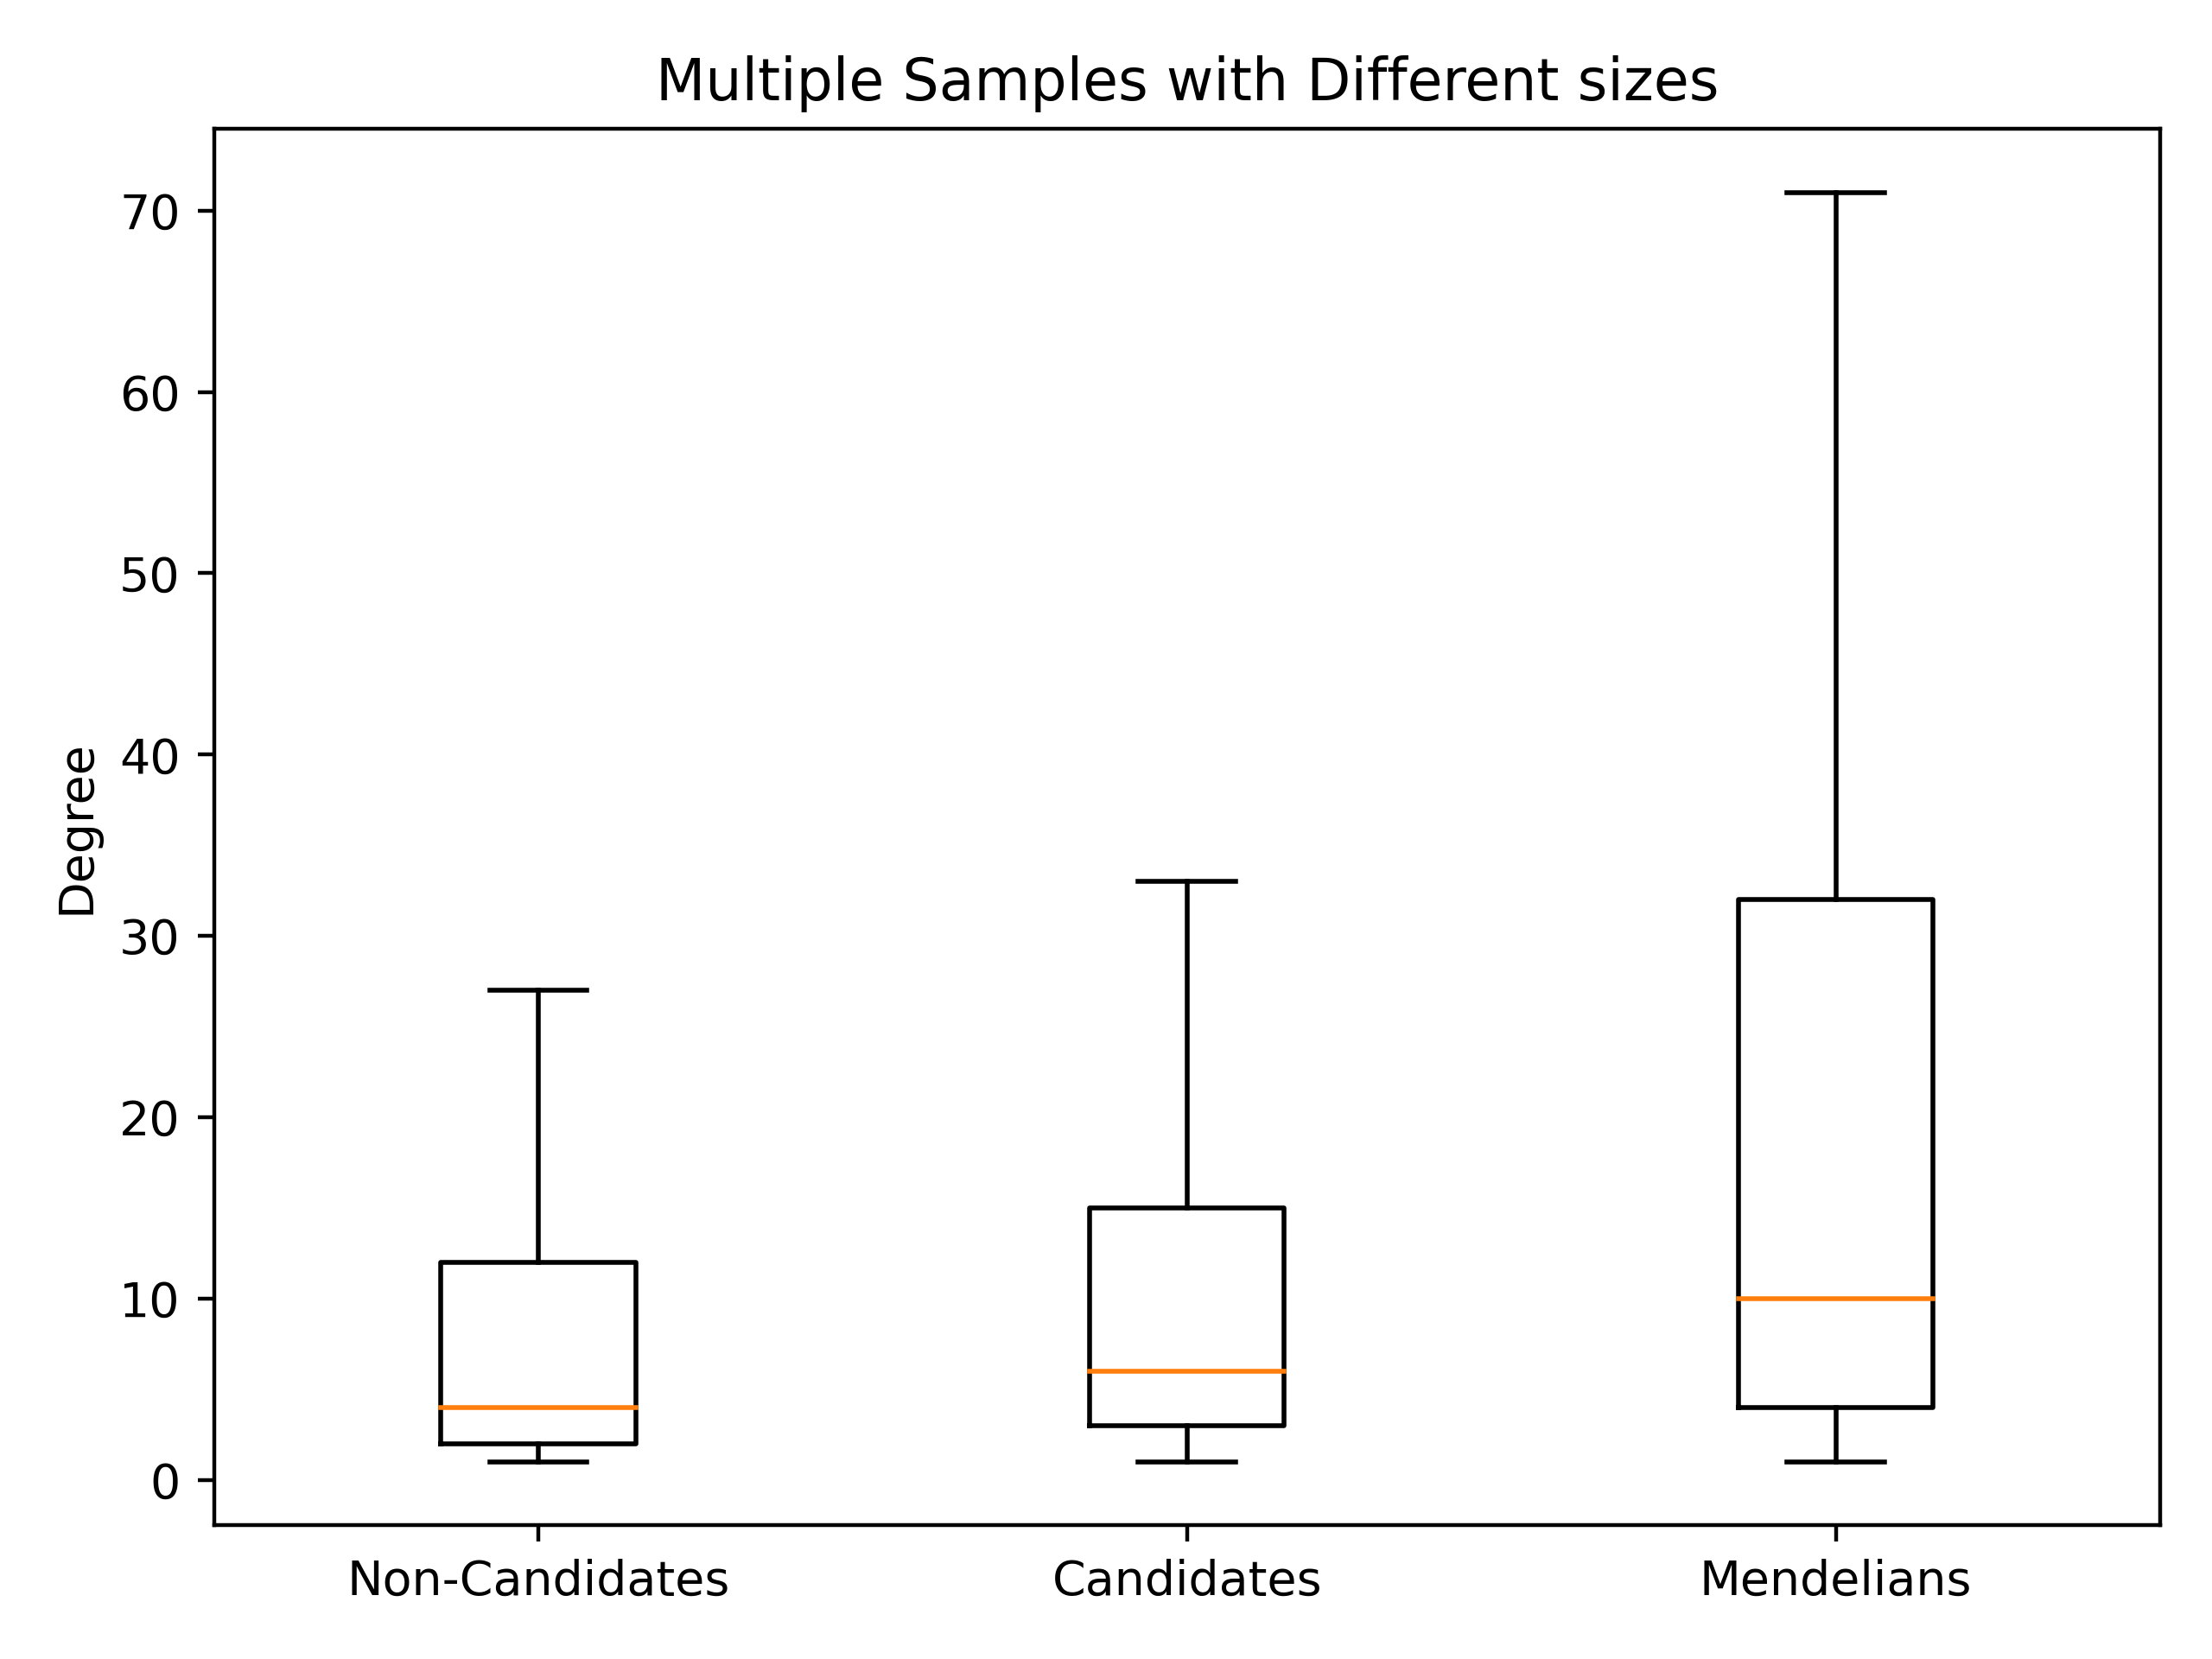
second part¶1cardiovascular_gcn 2023-02-22 14:50:28,355 [INFO] speos.postprocessing.postprocessor: U-Test for number of Drug interactions in Predicted Genes vs Non-Predicted Genes. q: 1.09e-09, U: 2568714.0 2cardiovascular_gcn 2023-02-22 14:50:28,355 [INFO] speos.postprocessing.postprocessor: U-Test for number of Drug interactions in Mendelian Genes vs Non-Predicted Genes. q: 2.34e-31, U: 2268526.0 3cardiovascular_gcn 2023-02-22 14:50:28,355 [INFO] speos.postprocessing.postprocessor: U-Test for number of Drug interactions in Mendelian Genes vs Predicted Genes. q: 1.47e-08, U: 173255.5 4cardiovascular_gcn 2023-02-22 14:50:28,355 [INFO] speos.postprocessing.postprocessor: 0, 25, 50, 75 and 99% quantiles for Mendelians: [ 1. 4. 10. 32. 441.9] 5cardiovascular_gcn 2023-02-22 14:50:28,355 [INFO] speos.postprocessing.postprocessor: 0, 25, 50, 75 and 99% quantiles for Predicted Genes: [ 1. 3. 6. 15. 195.56] 6cardiovascular_gcn 2023-02-22 14:50:28,356 [INFO] speos.postprocessing.postprocessor: 0, 25, 50, 75 and 99% quantiles for Non-Predicted Genes: [ 1. 2. 4. 12. 153.04]
This part of the log tells us the median number of drugs treating each drug target gene and if this number differs between Mendelian disorder genes, predicted candidate genes and non-candidate genes. For this analysis, only genes with at least one drug targeting it are included.
As we can see, all three groups are significantly different from each other (all three p-values are significant) and while the median number of drug-gene interactions in the Mendelian disorder genes is 10, it is 6 for the candidates and 4 for the non-candidates. This is a fold increase of 2.5 and 1.5, respectively! In addition, the postprocessor generates a plot which shows the distributions:
Druggable Genes
This task is related to the drug target task, but less a validation and instead more of a prospective analysis. Instead of looking for drugs that are already targeted by an approved drug, it looks for genes (or, more correctly, their protein products) that are categorized as druggable. There are several ways to establish if a gene is druggable, most of which are based unstructural similarity to approved drug targets. We did not conduct these analyses but instead obtained a list of druggable genes from DGIdb, which compiles them from several publications. The task is split in to sections, the first just looks at druggable genes in general, while the second looks at druggable genes among the non-drug-targets, meaning genes that are not yet targeted by any drug.
Lets look at the first part:
first part¶1cardiovascular_gcn 2023-02-22 14:50:28,941 [INFO] speos.postprocessing.postprocessor: Reading druggable genes from ./data/dgidb/druggable_genome.tsv 2cardiovascular_gcn 2023-02-22 14:50:29,028 [INFO] speos.postprocessing.postprocessor: Total of 5776 druggable genes, 5127 of them match with our translation table. 3cardiovascular_gcn 2023-02-22 14:50:29,028 [INFO] speos.postprocessing.postprocessor: Found 265 druggable genes among the 584 known positive genes (p: 3.52e-16, OR: 2.029), leaving 4862 in 16736 Unknowns 4cardiovascular_gcn 2023-02-22 14:50:29,042 [INFO] speos.postprocessing.postprocessor: Fishers Exact Test for Druggable Genes among Predicted Genes. p: 8.37e-16, OR: 1.844 5cardiovascular_gcn 2023-02-22 14:50:29,043 [INFO] speos.postprocessing.postprocessor: Druggable Genes Confusion Matrix: 6[[ 330 4532] 7[ 451 11423]]
Here we see that, while in total 5776 genes are labeled as druggable, only 5127 match with the HGNC symbols that are contained in our graph.
Second, 265 of the 5127 druggable genes can be found within the 584 Mendelian disorder genes, which corresponds to an odds ratio (OR) of 2.029 with a p-value of 3.52e-16. This is not surprising, as we have seen earlier that the Mendelian disorder genes are enriched for drug targets and so, also for druggable genes. Then, 5127 - 265 = 4862 druggable genes are left in the total 16736 unlabeled genes from which we predict our candidates.
Third, when looking at the confusion matrix, 330 out of 781 (330 + 451) candidates are druggable, which corresponds to an OR of 1.844 with a p-value of 8.37e-16.
Now, lets look at the second part:
second part¶1cardiovascular_gcn 2023-02-22 14:50:29,043 [INFO] speos.postprocessing.postprocessor: Reading compound drug interaction graph from ./data/drkg/cgi.tsv 2cardiovascular_gcn 2023-02-22 14:50:30,105 [INFO] speos.postprocessing.postprocessor: Reading translation table from ./data/hgnc_official_list.tsv 3cardiovascular_gcn 2023-02-22 14:50:30,518 [INFO] speos.postprocessing.postprocessor: Total of 2115 druggable genes which are not yet Drug Targets, 1672 of them match with our translation table. 4cardiovascular_gcn 2023-02-22 14:50:30,518 [INFO] speos.postprocessing.postprocessor: Found 18 druggable non drug target genes among the 113 known positive genes (p: 5.44e-01, OR: 0.822), leaving 1654 in 8826 Unknowns 5cardiovascular_gcn 2023-02-22 14:50:30,523 [INFO] speos.postprocessing.postprocessor: Fishers Exact Test for Druggable Non Drug Target Genes among Predicted Genes. p: 2.72e-01, OR: 1.23 6cardiovascular_gcn 2023-02-22 14:50:30,523 [INFO] speos.postprocessing.postprocessor: Druggable Genes Confusion Matrix: 7[[ 37 1617] 8[ 131 7041]]
This time, all known drug targets are removed from the gene pool and the same analysis is repeated. We see that, while in total 2115 non-drug-targets are labeled as druggable, only 1672 match with the HGNC symbols that are contained in our graph.
Second, 18 of the 1672 druggable non-drug-targets can be found within the 113 non-drug-target Mendelian disorder genes, which corresponds to an odds ratio (OR) of 0.822 with a p-value of 5.44e-01. In contrast to the earlier finding we now see that, albeit non-significant, the Mendelian disorder genes are slightly depleted of novel drug-targets-to-be, meaning that they have largely exhausted their potential for innovation in drug development. 1672 - 18 = 1654 druggable non-drug-targets are left in the total 8826 unlabeled druggable non-drug-targets.
Third, when looking at the confusion matrix, 37 out of 168 (37 + 131) candidates are druggable non-drug-targets, which corresponds to an OR of 1.23 with a p-value of 2.72e-01. While this is still not significantly different from 1, it is a slightly higher odds ratio than the Mendelians. This is the hardest odds ratio to get a significant result for, as the general setup of the method makes the candidates similar to the Mendelians, but to be significant here, they also have to be different in this single aspect. You can check our preprint to see which methods routinely deliver signifcant results here.
Mouse Knockout Enrichment
As core genes are defined as producing the phenotype directly, disrupting a gene’s function is likely to induce the phenotype. In the case of Mendelian disorder genes, it even single-handedly produces the phenotype.
To get a more systematic assessment of phenotypic enrichment we gathered knockout data from the Mouse Genome Database for five diseases. For a detailed description on how we obtained the genes, consult the methods section in our preprint.
Note
This task is disease-specific. We have added mouse KO genes for five diseases, which are also discussed in our preprint. Adding new KO genes for these or other, potentially custom, diseases is documented here.
In the following, we will see how the mouse knockout analysis is reflected in the logs:
1cardiovascular_gcn 2023-02-22 14:50:30,643 [INFO] speos.postprocessing.postprocessor: Reading mouse knockout genes from ./data/mgi/background.txt
2cardiovascular_gcn 2023-02-22 14:50:31,324 [INFO] speos.postprocessing.postprocessor: Reading mouse knockout genes from ./data/mgi/cad_query.txt
3cardiovascular_gcn 2023-02-22 14:50:31,407 [INFO] speos.postprocessing.postprocessor: Total of 693 Mouse KO genes, 632 of them match with our translation table.
4cardiovascular_gcn 2023-02-22 14:50:31,407 [INFO] speos.postprocessing.postprocessor: Found 115 Mouse KO genes among the 584 known positive genes (p: 5.13e-47, OR: 6.737), leaving 517 in 14116 Unknowns
5cardiovascular_gcn 2023-02-22 14:50:31,412 [INFO] speos.postprocessing.postprocessor: Fishers Exact Test for mouse KO Genes among Predicted Genes. p: 2.01e-07, OR: 2.319
6cardiovascular_gcn 2023-02-22 14:50:31,412 [INFO] speos.postprocessing.postprocessor: Mouse KO Confusion Matrix:
7[[   55   462]
8[  664 12935]]
Here we see that, while in total 693 genes produce the phenotype of cardiovascular disease when knocked out, only 632 match with the HGNC symbols that are contained in our graph.
Second, 115 of the 632 knockout genes can be found within the 584 Mendelian disorder genes, which corresponds to an odds ratio (OR) of 6.737 with a p-value of 5.13e-47. Then, 632 - 115 = 517 knockout genes are left in the total 14116 unlabeled genes for which mouse knockout experiments have been performed.
Third, when looking at the confusion matrix, 55 out of 719 (55 + 664) tested candidates are knockout genes, which corresponds to an OR of 2.319 with a p-value of 2.01e-07. So, while not as high as the Mendelian disorder genes, the candidate genes are also significantly enriched for mouse knockout genes, meaning that they are representative for the phenotype.
Functional Mutation Intolerance
If genes have vital function for survival they usually accumulate fewer functional mutations in the population. Such functional mutations are either loss of function (LoF) or missense mutations, which can both result in a drastic change of protein structure and activity.
Large cohorts have been tested and examined where such mutations occur, and for each gene, it’s intolerance to such mutations has been used as an indicator of importance. Our analysis for functional mutation intolerance is split into two parts, the first examines LoF intolerance by the pLI score, which ranges from 0, meaning tolerant to LoF mutations, to 1, meaning intolerant to LoF mutations. Here, we place the cutoff at pLI > 0.8 top say that a gene is LoF intolerant:
first part¶1cardiovascular_gcn 2023-02-22 14:50:32,522 [INFO] speos.postprocessing.postprocessor: Total of 3230 genes with significant LoF Intolerance, 2865 of them match with our translation table. 2cardiovascular_gcn 2023-02-22 14:50:32,522 [INFO] speos.postprocessing.postprocessor: Found 113 LoF Intolerance genes among the 584 known positive genes (p: 6.96e-02, OR: 1.219), leaving 2752 in 16736 Unknowns 3cardiovascular_gcn 2023-02-22 14:50:32,527 [INFO] speos.postprocessing.postprocessor: Fishers Exact Test for genes with significant LoF Intolerance among Predicted Genes. p: 8.71e-03, OR: 0.754 4cardiovascular_gcn 2023-02-22 14:50:32,527 [INFO] speos.postprocessing.postprocessor: LoF Intolerance Confusion Matrix: 5[[ 102 2650] 6[ 679 13305]]
Here we see that, while in total 3230 genes are LoF intolerant, only 2865 match with the HGNC symbols that are contained in our graph.
Second, 113 of the 2865 LoF intolerant genes can be found within the 584 Mendelian disorder genes, which corresponds to an odds ratio (OR) of 1.21 with a p-value of 6.96e-02. Then, 2865 - 113 = 2752 LoF intolerant genes are left in the total 16736 unlabeled genes from which we predict our candidates.
Third, when looking at the confusion matrix, 102 out of 781 (102 + 679) candidates are LoF intolerant genes, which corresponds to an OR of 0.754 with a p-value of 8.71e-03. So, interestingly, the candidates are even slightly but significantly depleted for genes with pLI > 0.8!
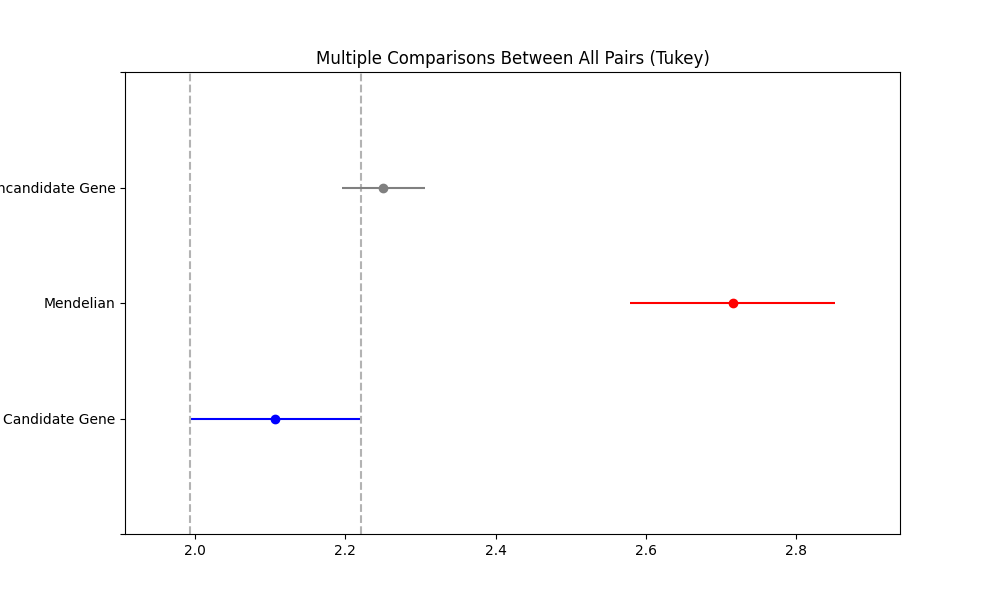
In the second part, instead of the pLI score we use the Z-score for LoF and missense mutation intolerance. We compare the mean Z-score in the three groups Mendelian disorder gene, candidate gene and non-candidate gene:
second part¶1cardiovascular_gcn 2023-02-22 14:50:32,535 [INFO] speos.postprocessing.postprocessor: ANOVA for LoF Z Value in Predicted Genes vs Non-Predicted Genes (Unknowns). p: 8.66e-09, F: 18.586 2cardiovascular_gcn 2023-02-22 14:50:34,362 [INFO] speos.postprocessing.postprocessor: Multiple Comparison of Means - Tukey HSD, FWER=0.05 3======================================================================= 4 group1 group2 meandiff p-adj lower upper reject 5----------------------------------------------------------------------- 6Candidate Gene Mendelian 0.6084 0.0 0.3577 0.859 True 7Candidate Gene Noncandidate Gene 0.1437 0.1159 -0.026 0.3134 False 8 Mendelian Noncandidate Gene -0.4647 0.0 -0.6566 -0.2727 True 9---------------------------------------------------------------------- 10 11cardiovascular_gcn 2023-02-22 14:50:34,498 [INFO] speos.postprocessing.postprocessor: ANOVA for Missense Z Value in Predicted Genes vs Non-Predicted Genes (Unknowns). p: 7.80e-02, F: 2.552 12cardiovascular_gcn 2023-02-22 14:50:34,821 [INFO] speos.postprocessing.postprocessor: Multiple Comparison of Means - Tukey HSD, FWER=0.05 13====================================================================== 14 group1 group2 meandiff p-adj lower upper reject 15---------------------------------------------------------------------- 16Candidate Gene Mendelian 0.1332 0.352 -0.0932 0.3597 False 17Candidate Gene Noncandidate Gene -0.0314 0.8804 -0.1847 0.1219 False 18 Mendelian Noncandidate Gene -0.1647 0.0669 -0.3381 0.0087 False 19----------------------------------------------------------------------
First, we conduct an ANOVA to see if there are significant differences between the groups. Then, we conduct a pairwise comparison using Tukey’s HSD. As we can see, the Mendelians are different (reject is True) from the candidates and non-candidates. However, the candidates are not different from non-candidates.
Afterwards, the same is repeated for missense mutation intolerance. Here, the ANOVA is not significant, indicating that there are no significant differences between the groups. The Tukey’s HSD results table corroborates this finding.
This task also produces plots that compare the confidence intervals of the three groups sourced from the Tukey’s HSD test:
And the same for missense mutations:
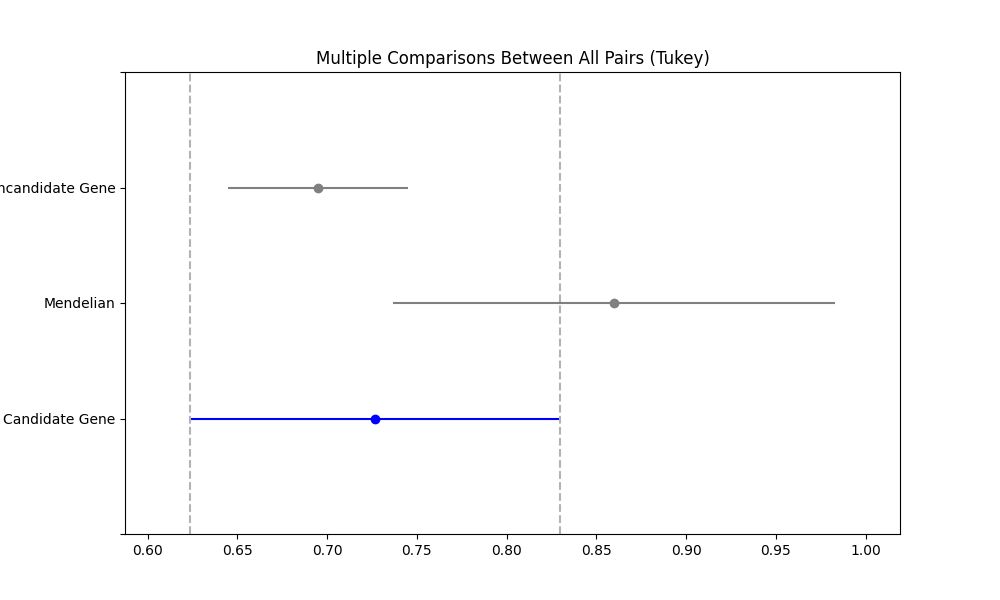
As we can see, none of the candidate groups is different from the noncandidates. This means that this external validation does not conclude in favor of the candidate genes. However, as we have detailed in our preprint, the GCN layer is not optimal for this task! You can check the figures in the preprint which method produces better results (Spoiler: The TAG and FILM layers!)